A solution that combined computer vision, sentiment analysis and visualization technologies to automate the extraction of insight from customer feedback forms.
Challenge
A training company in the professional services space needed to decrease the time and effort it took to extract handwritten comments from its customer feedback forms, and to better understand the factors that contributed to both positive and negative comments.
This exercise required staff to transcribe the comments and categorize them manually while searching for insights. The time-consuming aspect of this process made it so the company did this only occasionally and as-needed, potentially missing opportunities to address client concerns in a timely manner.
Solution
NovaceneAI worked with the marketing team to develop a solution that:
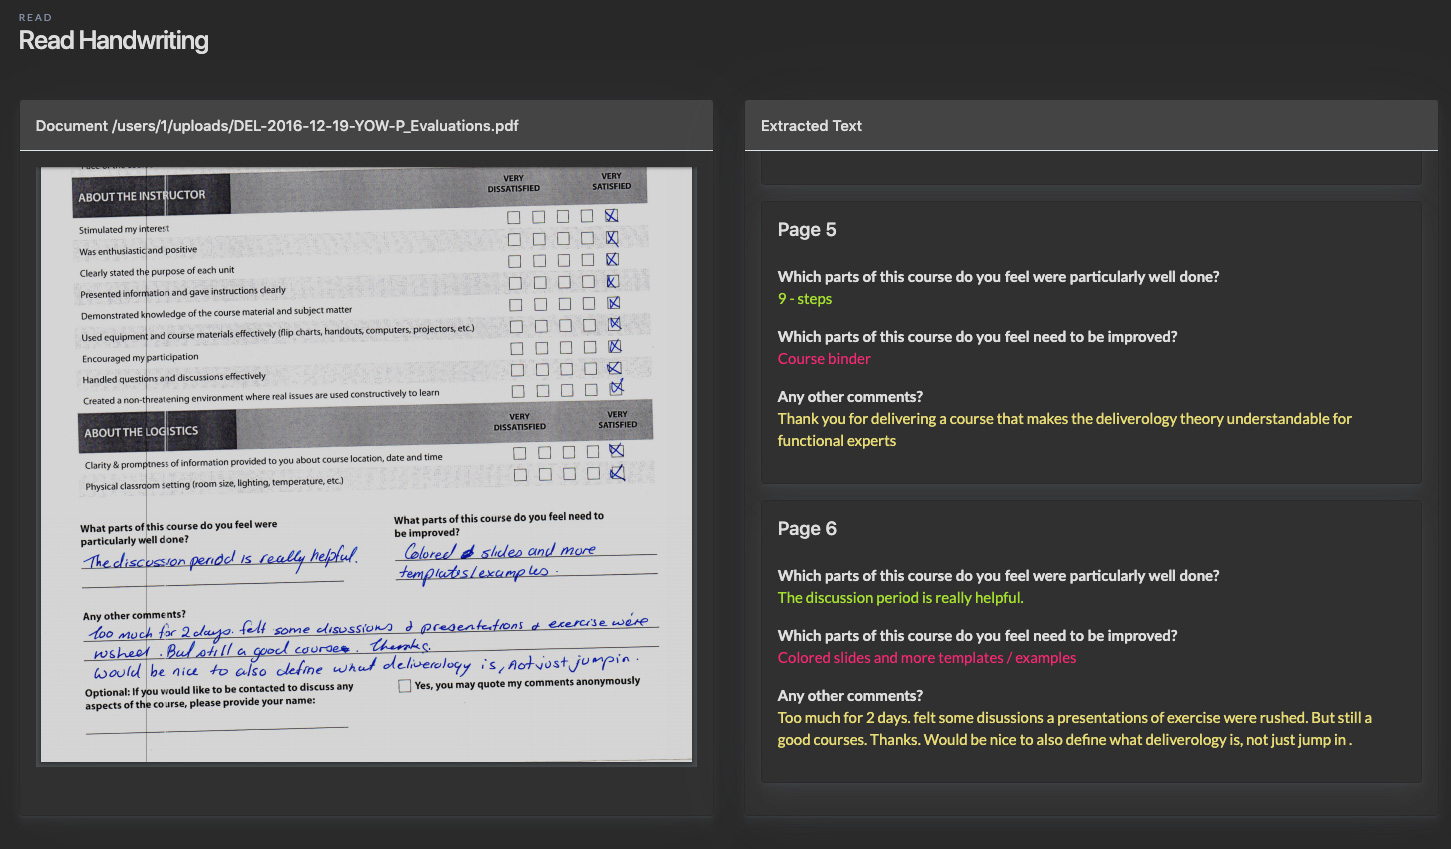
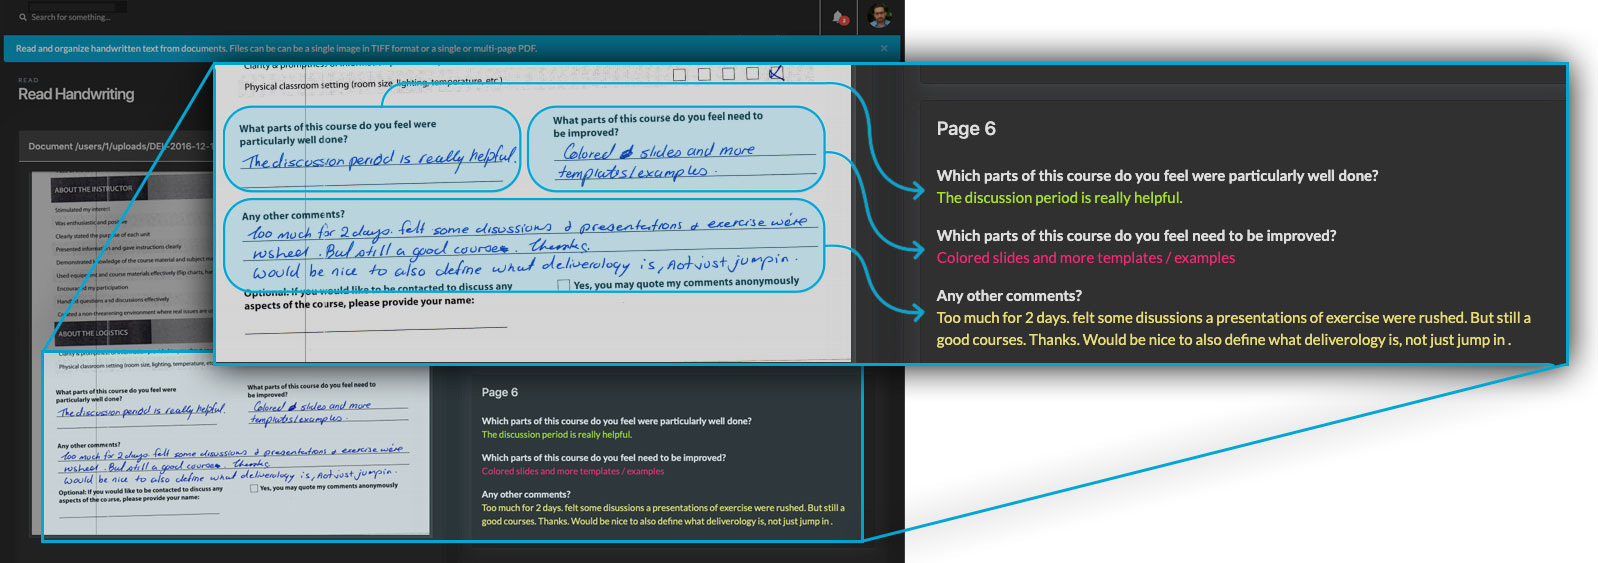
- automated the extraction of the handwritten comments;
- performed sentiment analysis to determine whether comments were positive, negative or neutral; and
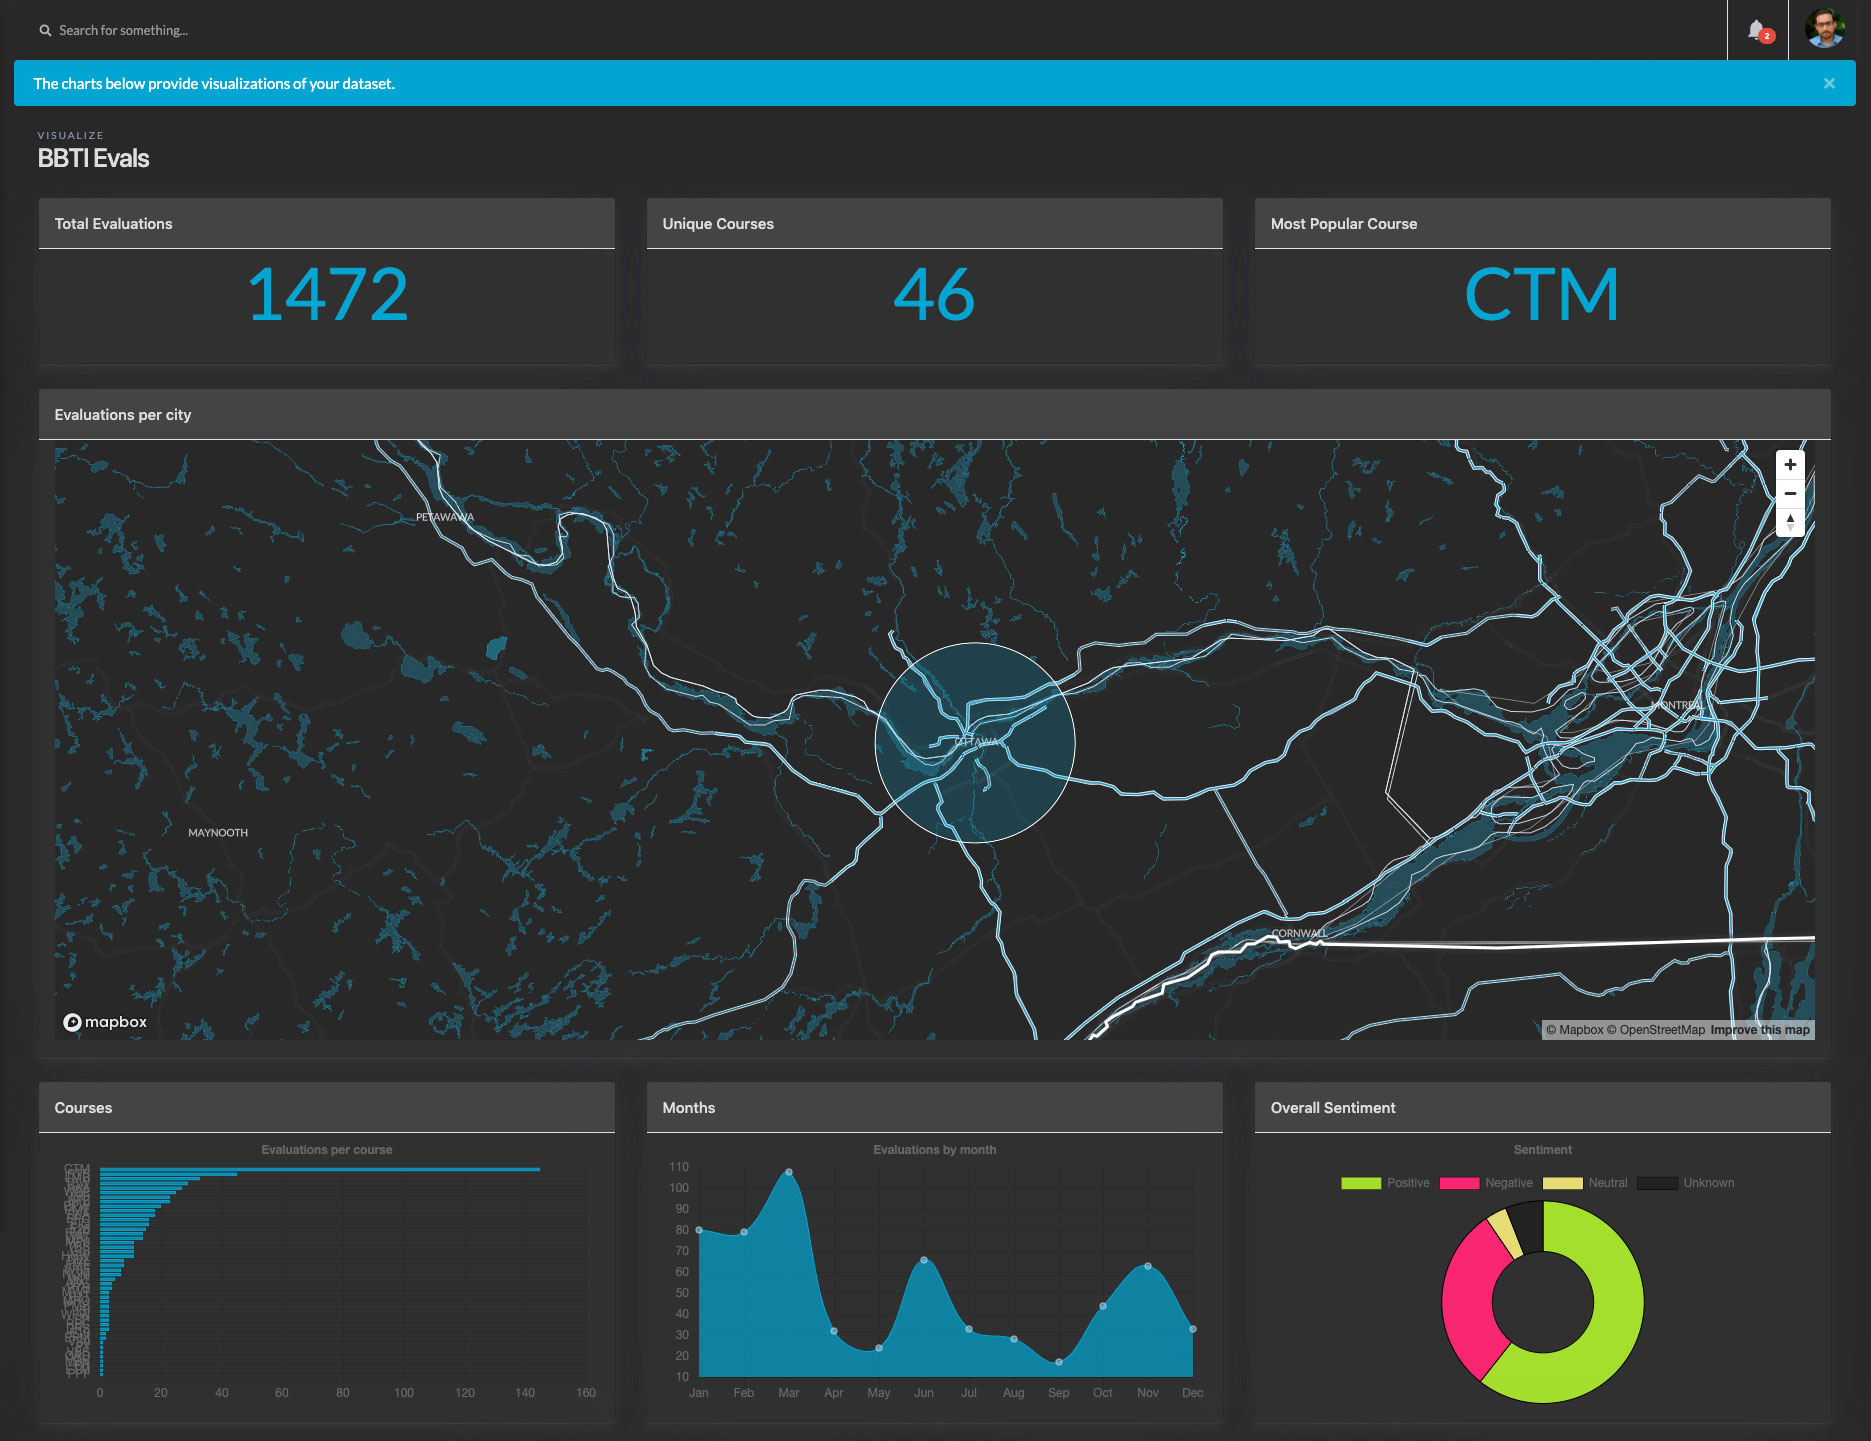
- presented the information on an easy-to-understand dashboard.
We used computer vision technology to automatically “read and transcribe” the handwritten comments into structured data. We then applied natural language understanding (NLU) technology to perform sentiment analysis. Finally, we created a dashboard comprised of several data visualization widgets.
We suspected that AI could help us in many areas of our business, but it wasn’t until we saw what was possible that we truly understood its potential. We look forward to working with NovaceneAI again and explore other use cases.
Stephen Shivkumar, President
Building Blocks Technologies
Outcome
The solution enabled the company to:
- automate the process of extracting comments from printed forms;
- process thousands of forms in minutes;
- automatically categorize comments by sentiment;
- visualize the most common issues; and
- visualize seasonality and geographic distribution of feedback;
The solution was developed as a SaaS application that can be accessed 24/7 by the company’s non-technical staff.